Here I am again with my lovely thesis...
After some trials with Qt and inheriting Qwt classes to plot good graphs on my user interface,
finally I found out the way to paint graphs and to show some buttons at the same time.
First of all I was creating QMainWindows, setting
my plot (inherited from QwtPlot) as the main widget of the window. But this way did not allow me to plot buttons, ButtonGroups, etc...
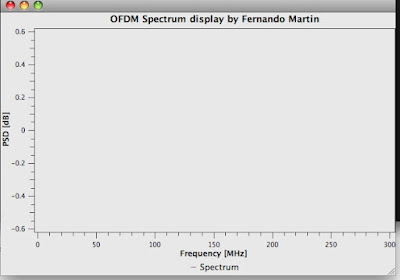
Setting the plot as main widget associated the whole graph to the entire window as following:

So, this was really limited for my purposes... :(
I got a bit crazy trying to plot more stuff in this mainwindow, but I (fortunately) gave up quick...
I discovered thanks to "C++ GUI Programming with Qt 4", book by Jasmin Blanchette & Mark Summerfield, that my best option was creating a QDialog and create the user interface window coding my own.
Qt Designer allows you to paint things manually, but I really prefer to set up things from the core of the programme and know exactly what I am doing...
The result of my research in how to create dialogues today is as following:
Obviously, the graphs have nothing to do with what is written, and it is only a random flow of data, but the OFDM methods are not still implemented since they'll be taken from open source projects already working properly.
But I think that my knowledge on how to create the windows is quite enough for plotting what I want.
Next step: Link buttons and actions in the graphs, such stopping, saving the graphs in jpg, change functions plotted, etc...
Step by step and everyday closer...
Thanks for reading!


No comments:
Post a Comment